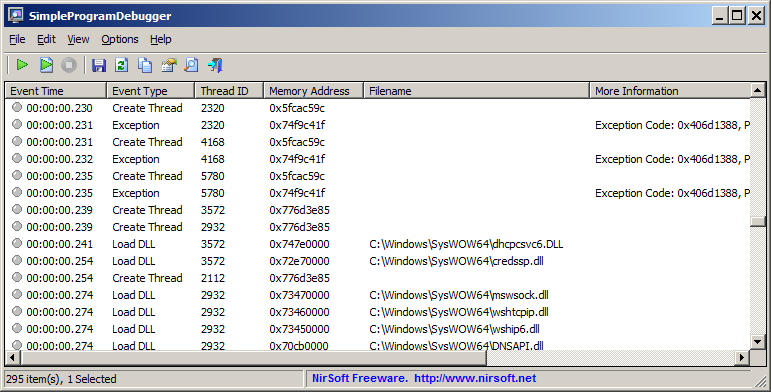
SimpleProgramDebugger is a simple debugging tool for Windows that attaches to existing running program or starts a new program in debugging mode, and then displays all major debugging events occurs while the program is running, including Exception, Create Thread, Create Process, Exit Thread, Exit Process, Load DLL, Unload Dll, and Debug String.
After the debugging events are accumulated, you can easily export them into comma-delimited/tab-delimited/xml/html file or copy them to the clipboard and then paste them into Excel or any other spreadsheet application.
SimpleProgramDebugger
You can download SimpleProgramDebugger utility from this Web page.

Daniel Lewis says:
You Sir are a seriously major GEEK! And I say that with the best intention and in the best definition of the term!
Seriously amazing site with so many useful tools constantly being updated and shared with the world–so very cool!
Thank you!
February 9, 2014, 2:54 amDaniel L.
Paul G says:
Thanks for this tool, Nir !
August 2, 2014, 10:18 amI have a few suggestions though for possible enhancements:
– please put the tracked Process ID and Name in the program’s window name (handy when multiples runs)
– some loaded DLLs do not display a name : can this be fixed ?
– an auto-filtering feature via two edit boxes (one to visually exclude, the other to visually highlight) in the toolbar would be great !
Thank you for your support !
Paul G.