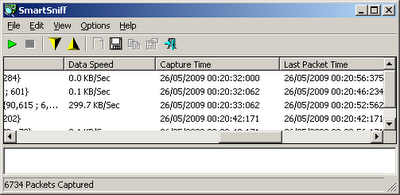
There are 2 new columns in SmartSniff utility: ‘Last Packet Time’ and ‘Data Speed’
The ‘Last Packet Time’ column displays the date/time of the last packet captured for the specified connection.
The ‘Data Speed’ column displays the calculated speed in KB/Sec. This speed is calculated by using the ‘Data Size’ value and the number of milliseconds elapsed since the first packet of this connection arrived.
NirBlog
The official blog of nirsoft.net


johnmccash says:
There appears to be at least one small bug in the new feature. I’ve been using it a bit over the last few days, and it occasionally flips the sign on the data rate to negative. stopping and restarting the capture fixes this. (I’m using it just to generate traffic statistics, so I’m not retaining the capture data.)I’ve also had it throw exceptions a couple of times. Here’s the exception data:
Exception C0000005 at address 10008455 in module wpcap.dll
June 2, 2009, 11:00 amRegisters:
EAX=00000000 EBX=00000000 ECX=00000064 EDX=00000000
ESI=00000000 EDI=7739CF99 EBP=0012E46C ESP=0012E428
EIP=10008455
Stack Data: 24 F8 12 00 D0 F9 40 00 00 00 00 00 01 00 00 00 1D F9 40 00 24 F8 12 00 50 F5 12 00 00 00 00 00 22 04 17 00 0B 04 00 00 00 00 00 00 00 00 00 00 6C 08 9D ED A3 00 00 00 3F 00 00 00 91 05 16 00 22 04 17 00 80 F4 12 00 70 FA 40 00 2C F8 12 00 00 00 00 00 18 07 15 00 A8 E6 12 00 D8 A0 82 7C 1C A1 82 7C 00 00 00 00 28 E7 12 00 50 18 2F 5F 00 00 00 00 00 00 00 00 00 00 00 00 00 00 81 01
Code Data: 8B 86 DC 01 00 00 85 C0 74 1C 8B 86 EC 01 00 00 85 C0 75 12 56 E8 B1 CA FF FF 83 C4 04 85 C0 74 05 83 C8 FF 5E C3 8B 44 24 14 8B 4C 24 10 8B 54 24 0C 50 51 52 56 FF 96 94 00 00 00 83 C4 10 5E C3 90 90 90 90 90 90 90 90 90 90 8B 44 24 10 8B 4C 24 0C 8B 54 24 08 50 8B 44 24 08 51 52 50 FF 90 94 00 00 00 83 C4 10 C3 90 90 53 55 56 8B 74 24 10 57 8B 86 DC 01 00 00 85 C0 74 1F 8B 86 EC